Meteorology
In our precision weather stations we take precise measurements every 10 minutes of the air temperature, humidity, pressure, rainfall, wind speed and direction and solar radiation.
The OpenLiving Lab is part of the award-winning OpenSTEM Labs of the Open University. You can view and access our weather data on the OpenLiving Lab pages of the OpenSTEM Labs. If you don’t have an OU account you will need to create a free one.
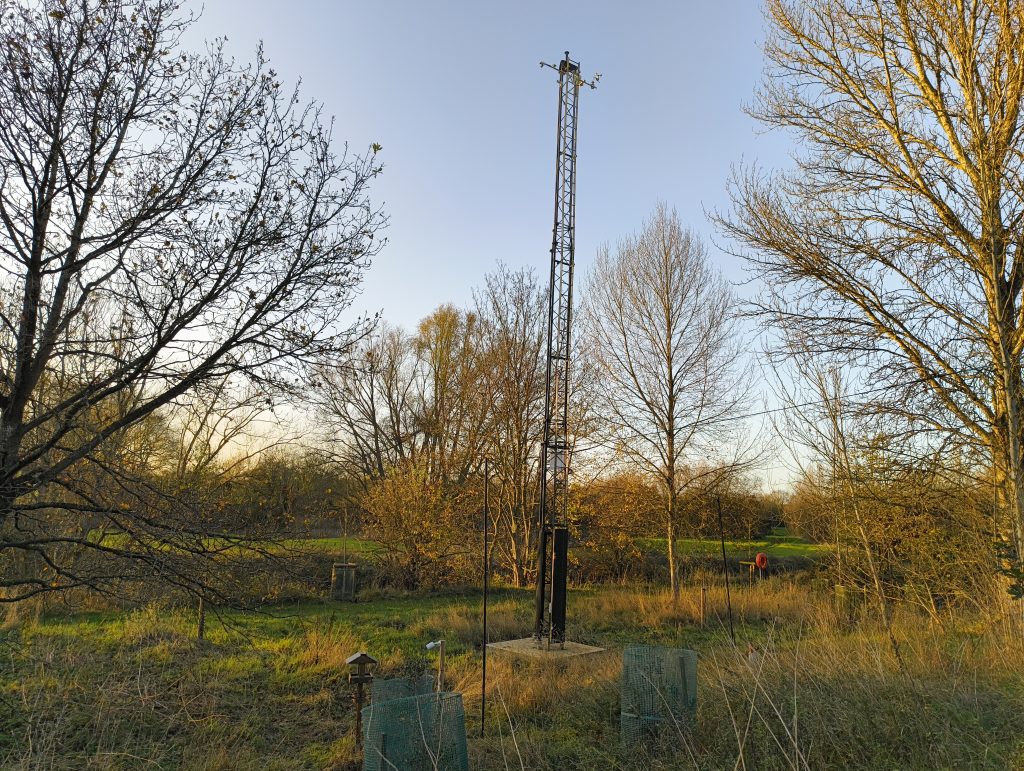
We have masts set up in the riparian woodland and urban woodland each equipped with:
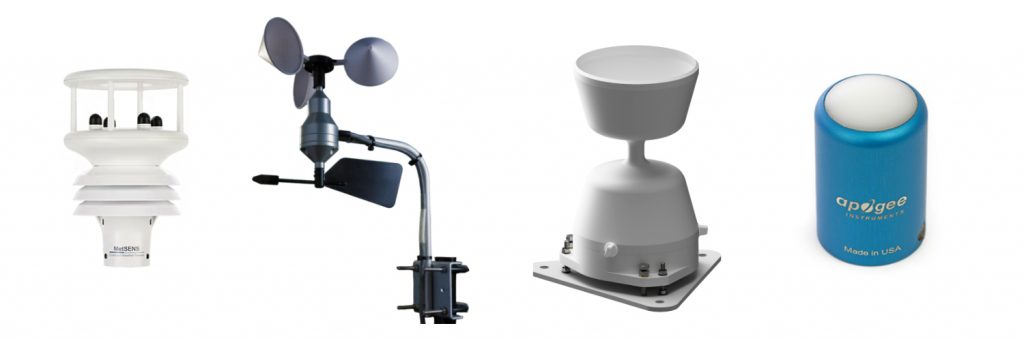
- HygroVUE 10 – a digital thermometer and relative humidity sensor that records air temperature and humidity
- MetSENS500 Compact Weather Sensor that records atmospheric (or barometric) pressure, wind speed and direction, air temperature and relative humidity.
- WSD1 sensor with 3-cupped anemometer for measuring wind speed and wind vane for measuring wind direction.
- Kalyx-RG Rain Gauge, which has an aerodynamic shape to reduce inaccuracies from wind blowing over the rim of the rain collecting cup.
- Apogee Pyranometer sensors (models SP510 and SP-610) that measure global shortwave radiation. One sensor measures incoming solar radiation and another measures reflected shortwave radiation from the earth’s surface.
- Apogee Quantum Sensor (Model SQ-500) to measure photosynthetically active radiation (PAR). We can think of this as the light that plants will use for photosynthesis with frequencies in the range 400 to 700 nm. This is usually measured as photosynthetic photon flux density (PPFD), which is the amount of photons of light in this frequency range (in micromoles) per square metre per second (μmol/m2/s).
At the base of the mast in the riparian woodland we measure environmental data on soil temperature, water content, electrical conductivity and matric potential at depths of 10 cm and 30 cm using:
- WET150 Sensors – these measure water content, temperature and electrical conductivity.
- EQ3 Equitensiometer – measures soil temperature and matric potential, which is the suction required to extract water from the matrix of soil particles.
Temperature data
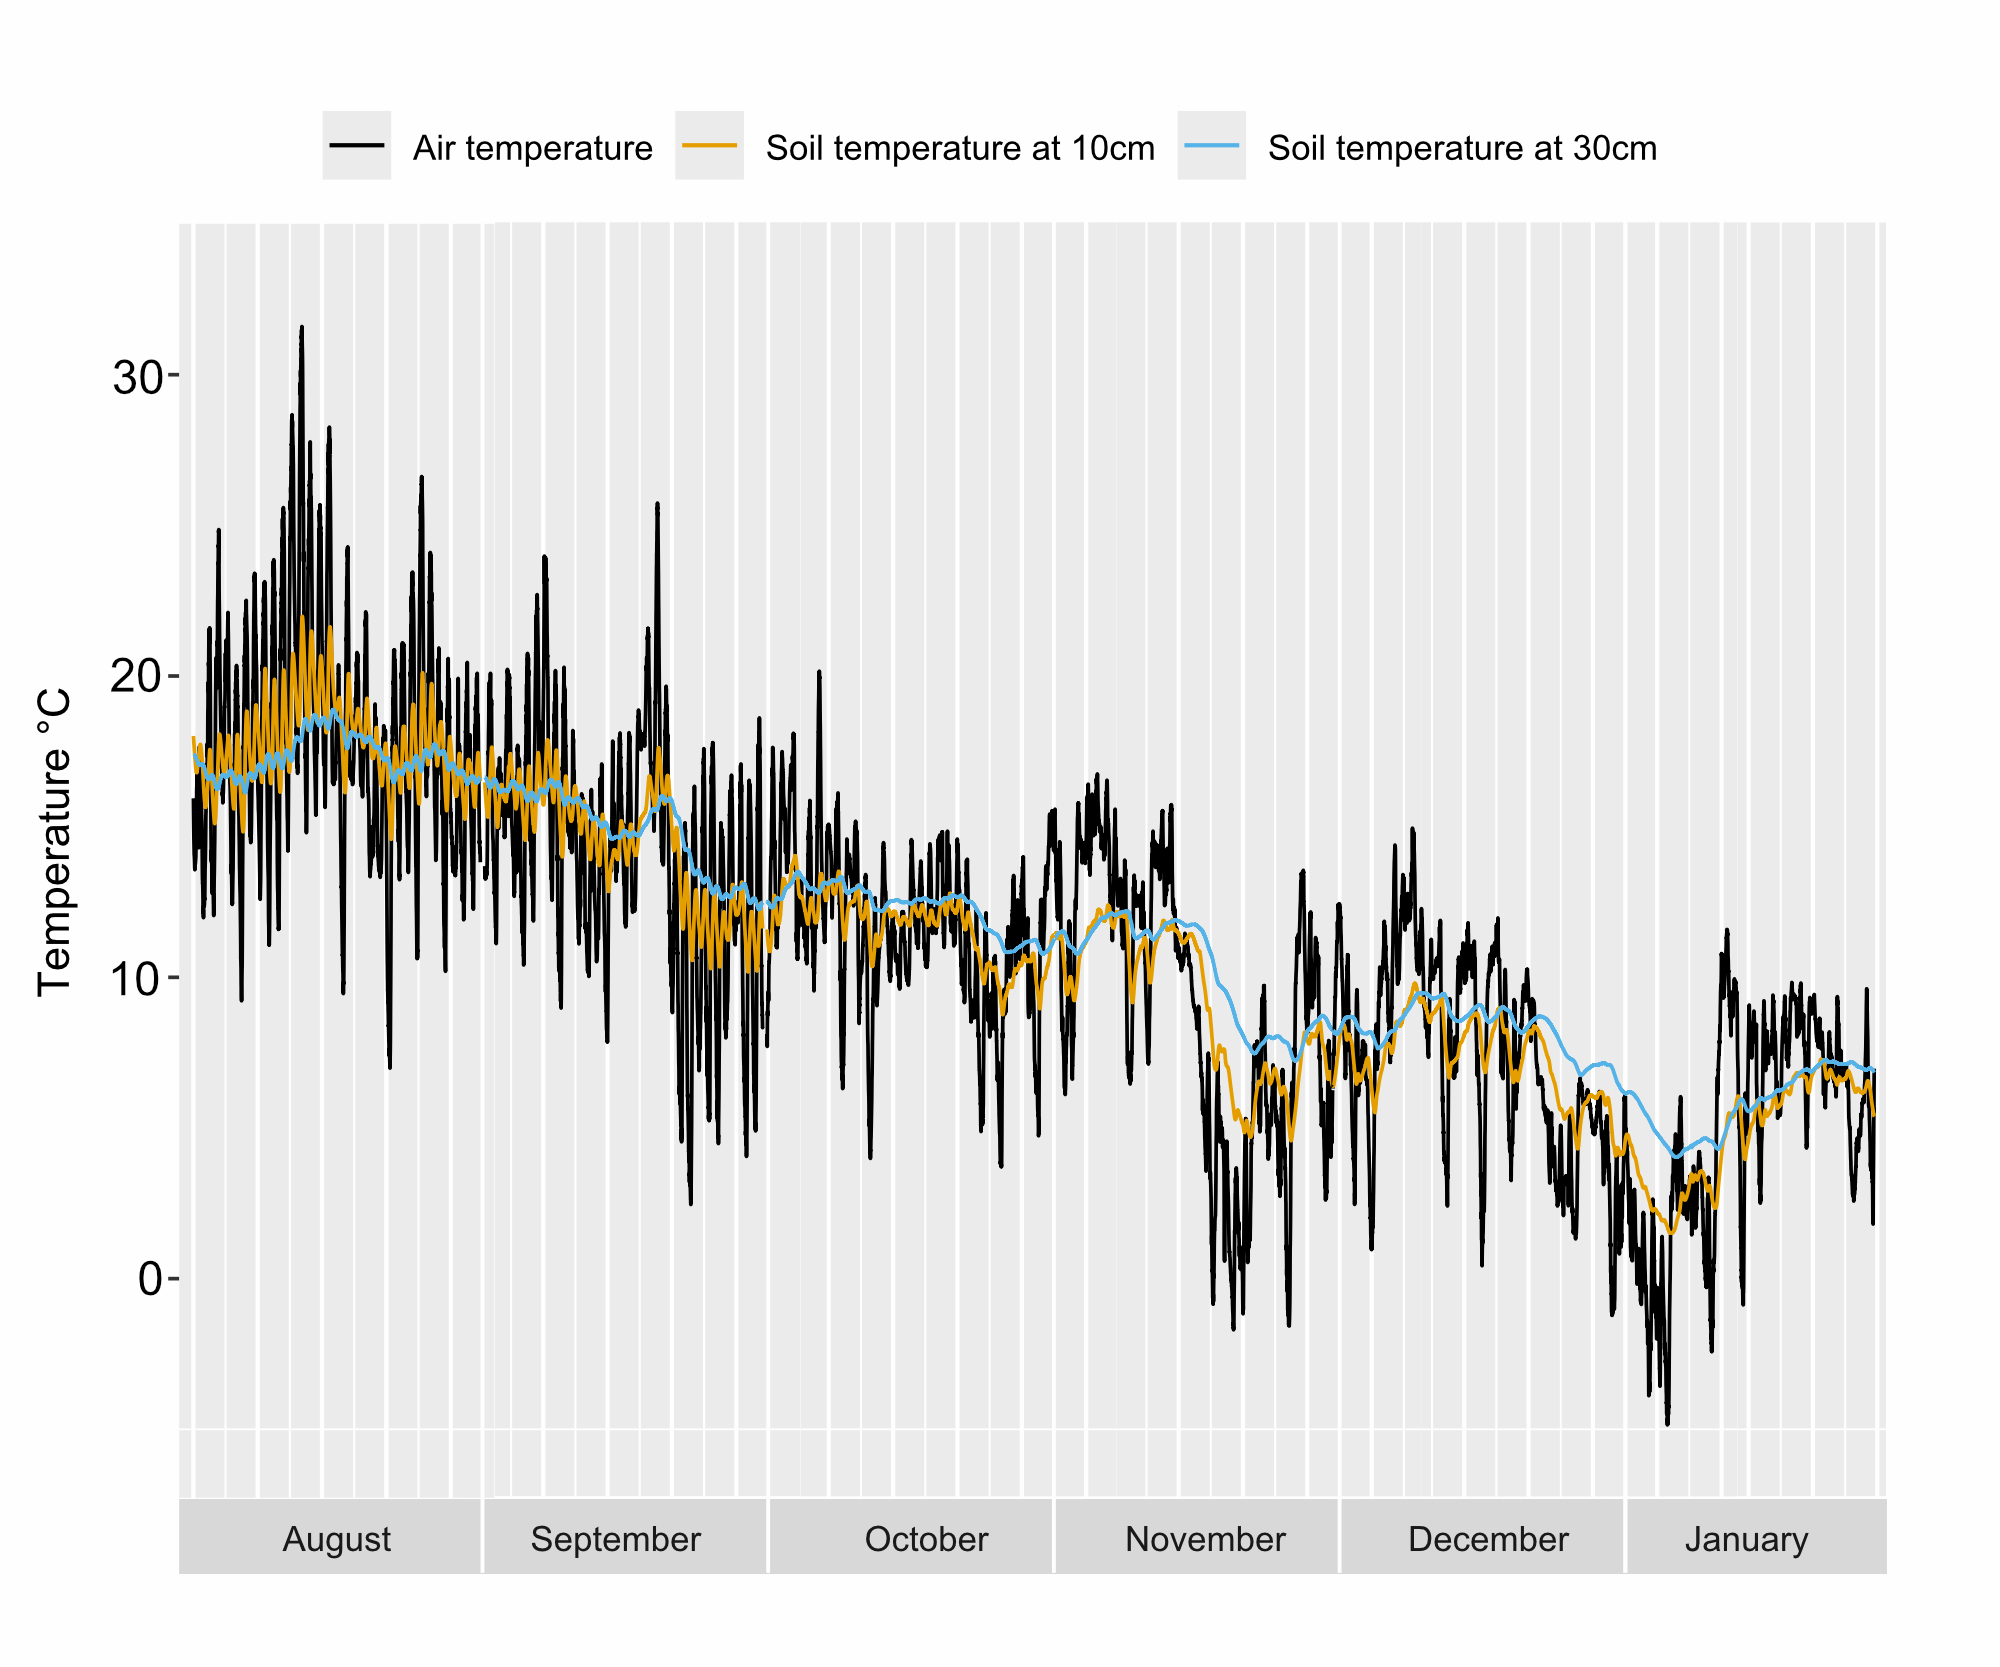
Between August 2025 and January 2026, air temperature peaked at 32°C and reached a minimum of 5°C. Readings were similar in the riparian and urban woodlands.
Soil temperature followed a similar pattern, peaking in late August and reaching the coldest point in mid January. Deeper soils stayed warmer with smaller fluctuations in temperature.
Solar irradiation and photosynthetically active radiation
Plants use radiation to photosynthesize, so in general more light will mean more plant growth. Most of this radiation comes from the sun as shortwave radiation in the wavelength range 280 to 4000 nm. The radiation that hits the earth’s surface (known as Global Shortwave Radiation or Shortwave Irradiance is measured in Watts per square meter (W m-2, which is equal to Joules per second per square meter).
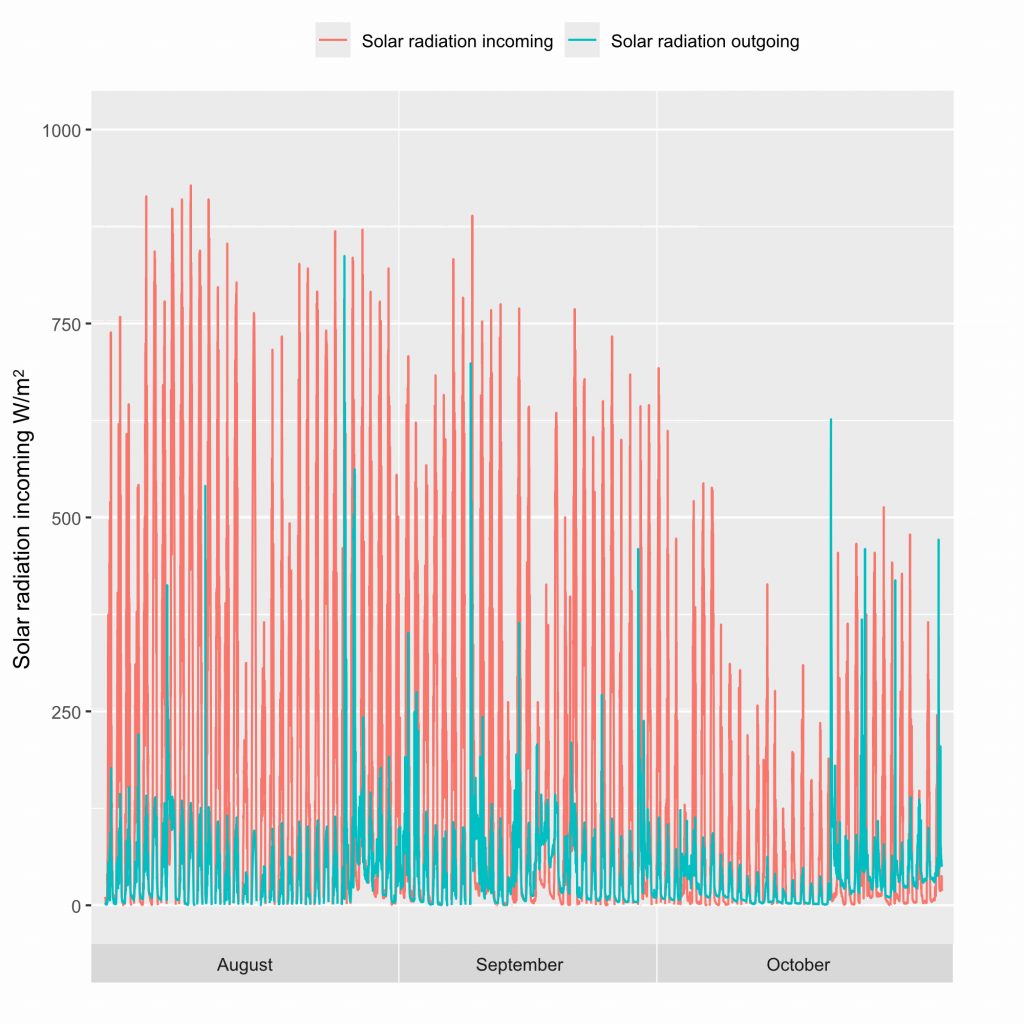
Our pyranometer sensors measure the incoming radiation from the sky hitting the horizontal surface of the sensor on the mast. Solar radiation at the top of the Earth’s atmosphere is around 1361 W/m2 and on a clear day, maximum solar irradiance at sea level is around 1000 W/m2. Incoming solar radiation measured by our sensors will vary depending on atmospheric conditions like cloud cover and seasonality.
Our sensors also measure outgoing solar radiation, that is, shortwave radiation reflected from terrestrial surfaces, which will depend on a range of factors such as the colour and type of nearby artificial surfaces, vegetation cover, temperature and rain or snow cover.
We can see how incoming solar radiation declined from August to October but there were peaks in outgoing radiation throughout that period. In an urban setting plants may also receive radiation from street lights or buildings.
Photosynthetically active organisms (like plants) only absorb energy of certain wavelengths, usually in the spectral range 400 to 700 nanometers. This is the visible light portion of the spectrum.
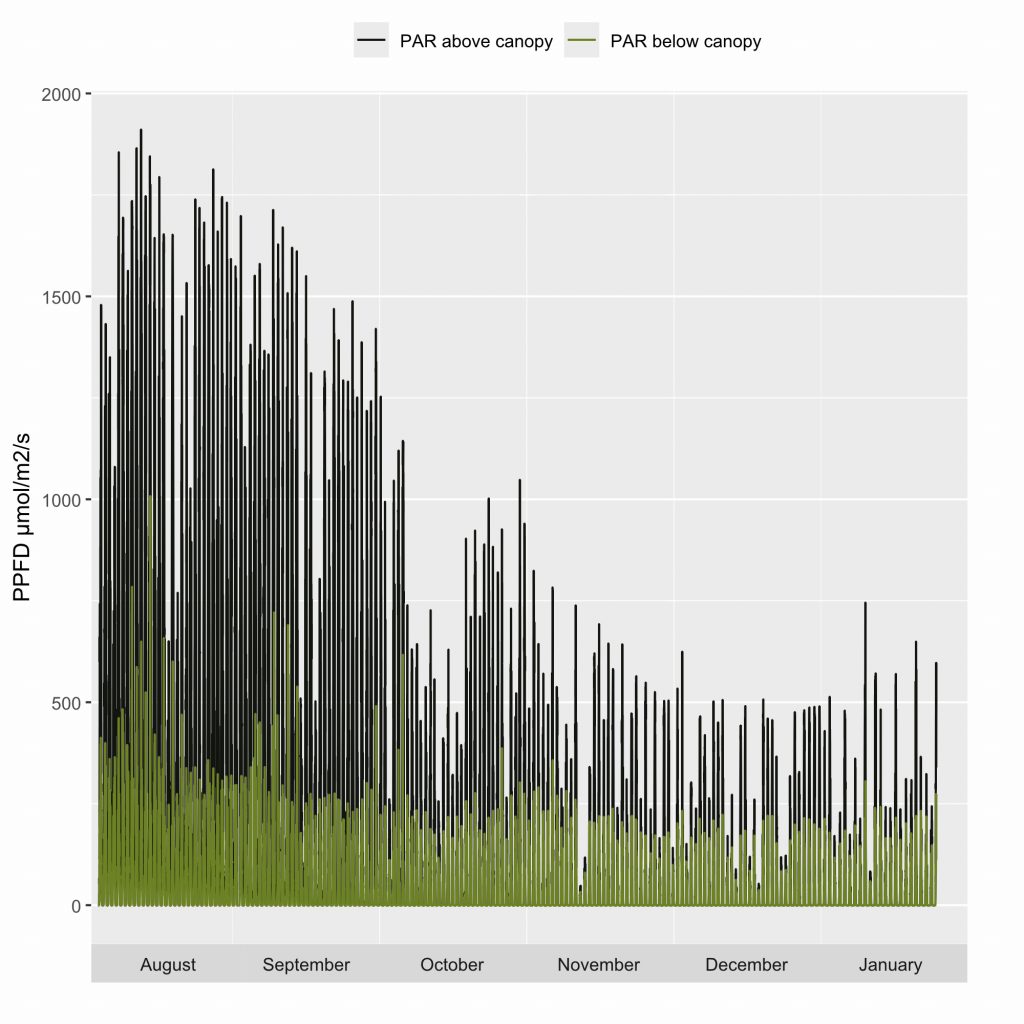
Photon sensors are sometimes called “Quantum Sensors” because a “quantum” or “photon” is the minimum quantity of light involved in physical interactions such as photosynthesis. The sensors measure Photosynthetically Active Radiation (PAR) as Photosynthetic Photon Flux Density in micromoles per m2 per second (μmol/m2/s).
We measure PAR above and below the canopy because different wavelengths (or colours) of light will penetrate through the leaves. We can see how this varies depending on the season and the weather.
Rain and soil moisture
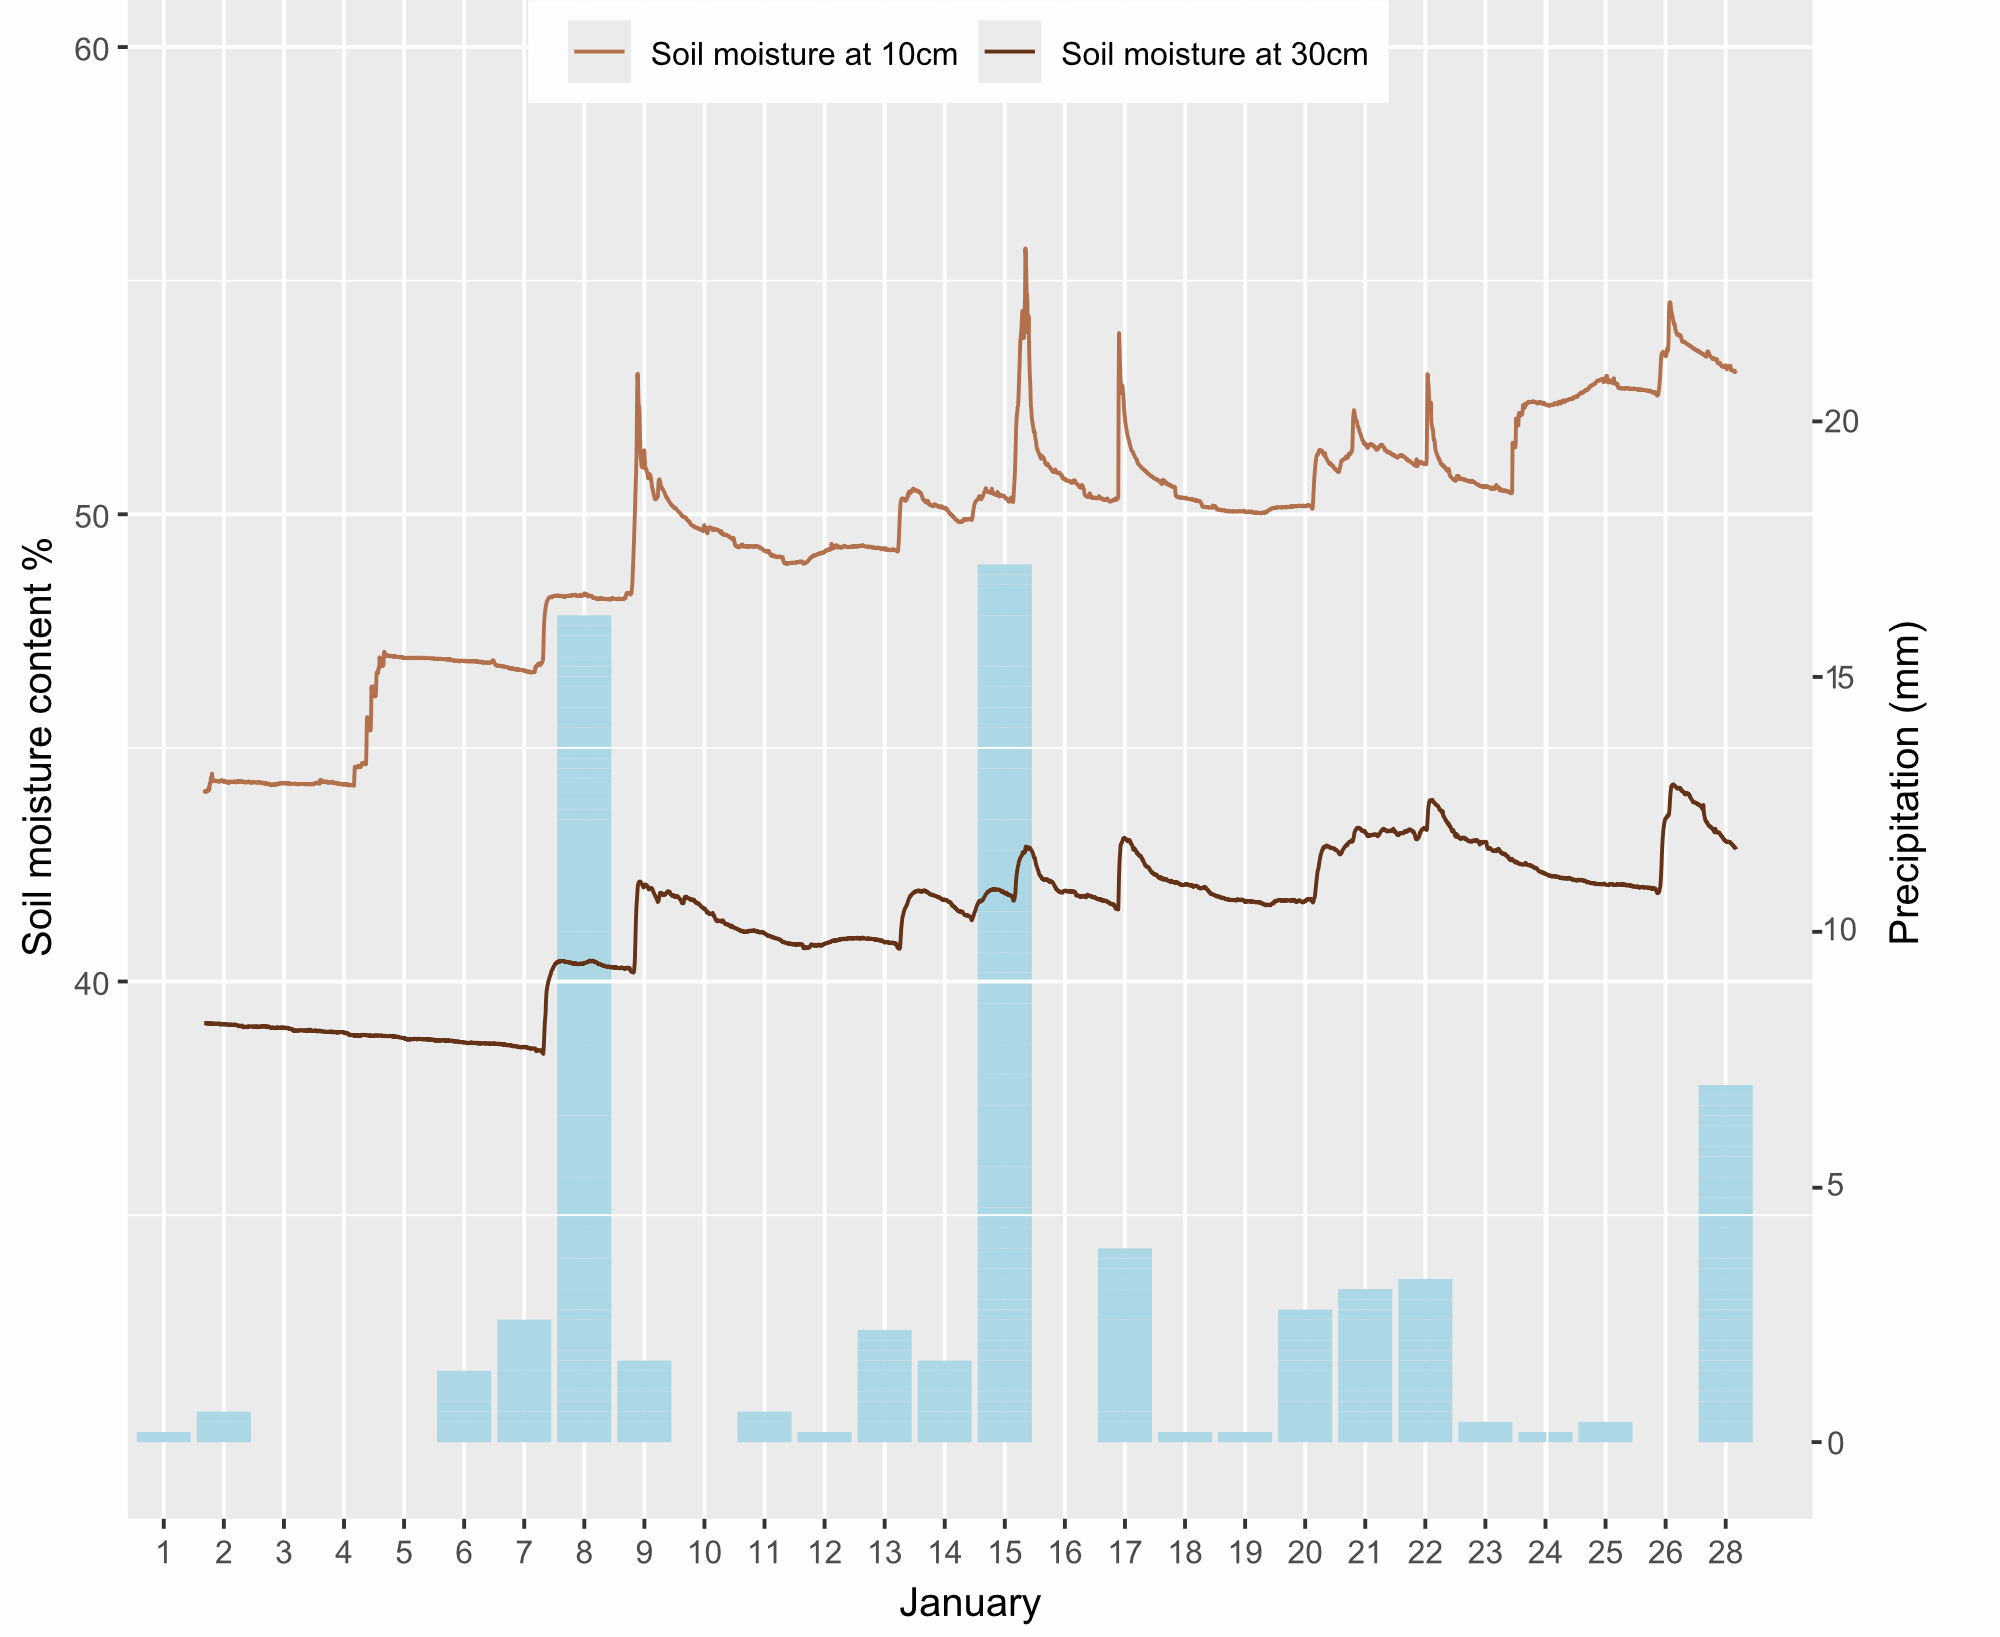
We can use the data from aerial and ground sensors to see how soil moisture at different depths is affected by precipitation. After a cold period with little or no precipitation from 22nd December 2025, in January 2026 it snowed on the 6th and 8th and rained on the 15th and 17th January, with our sensors detecting over 1mm of precipitation on these dates.
Soil water content at 10cm rose from 43% around December 31st to a peak of over 55% when it rained on January 15th. Soils at this level fluctuate more in their saturation level.
Soil water content at 30cm only started to rise after the snow events on 6th and 8th January as the ground begain to thaw. It continued to rise to around 44% saturation as it rained more during the month.
We can see how the soils at different depths are responding to changes in the weather, storing water and helping to prevent flooding events. As vegetation changes during habitat restoration we will be able to see how this is affecting the storage capacity of our woodland and floodplain meadow soils.
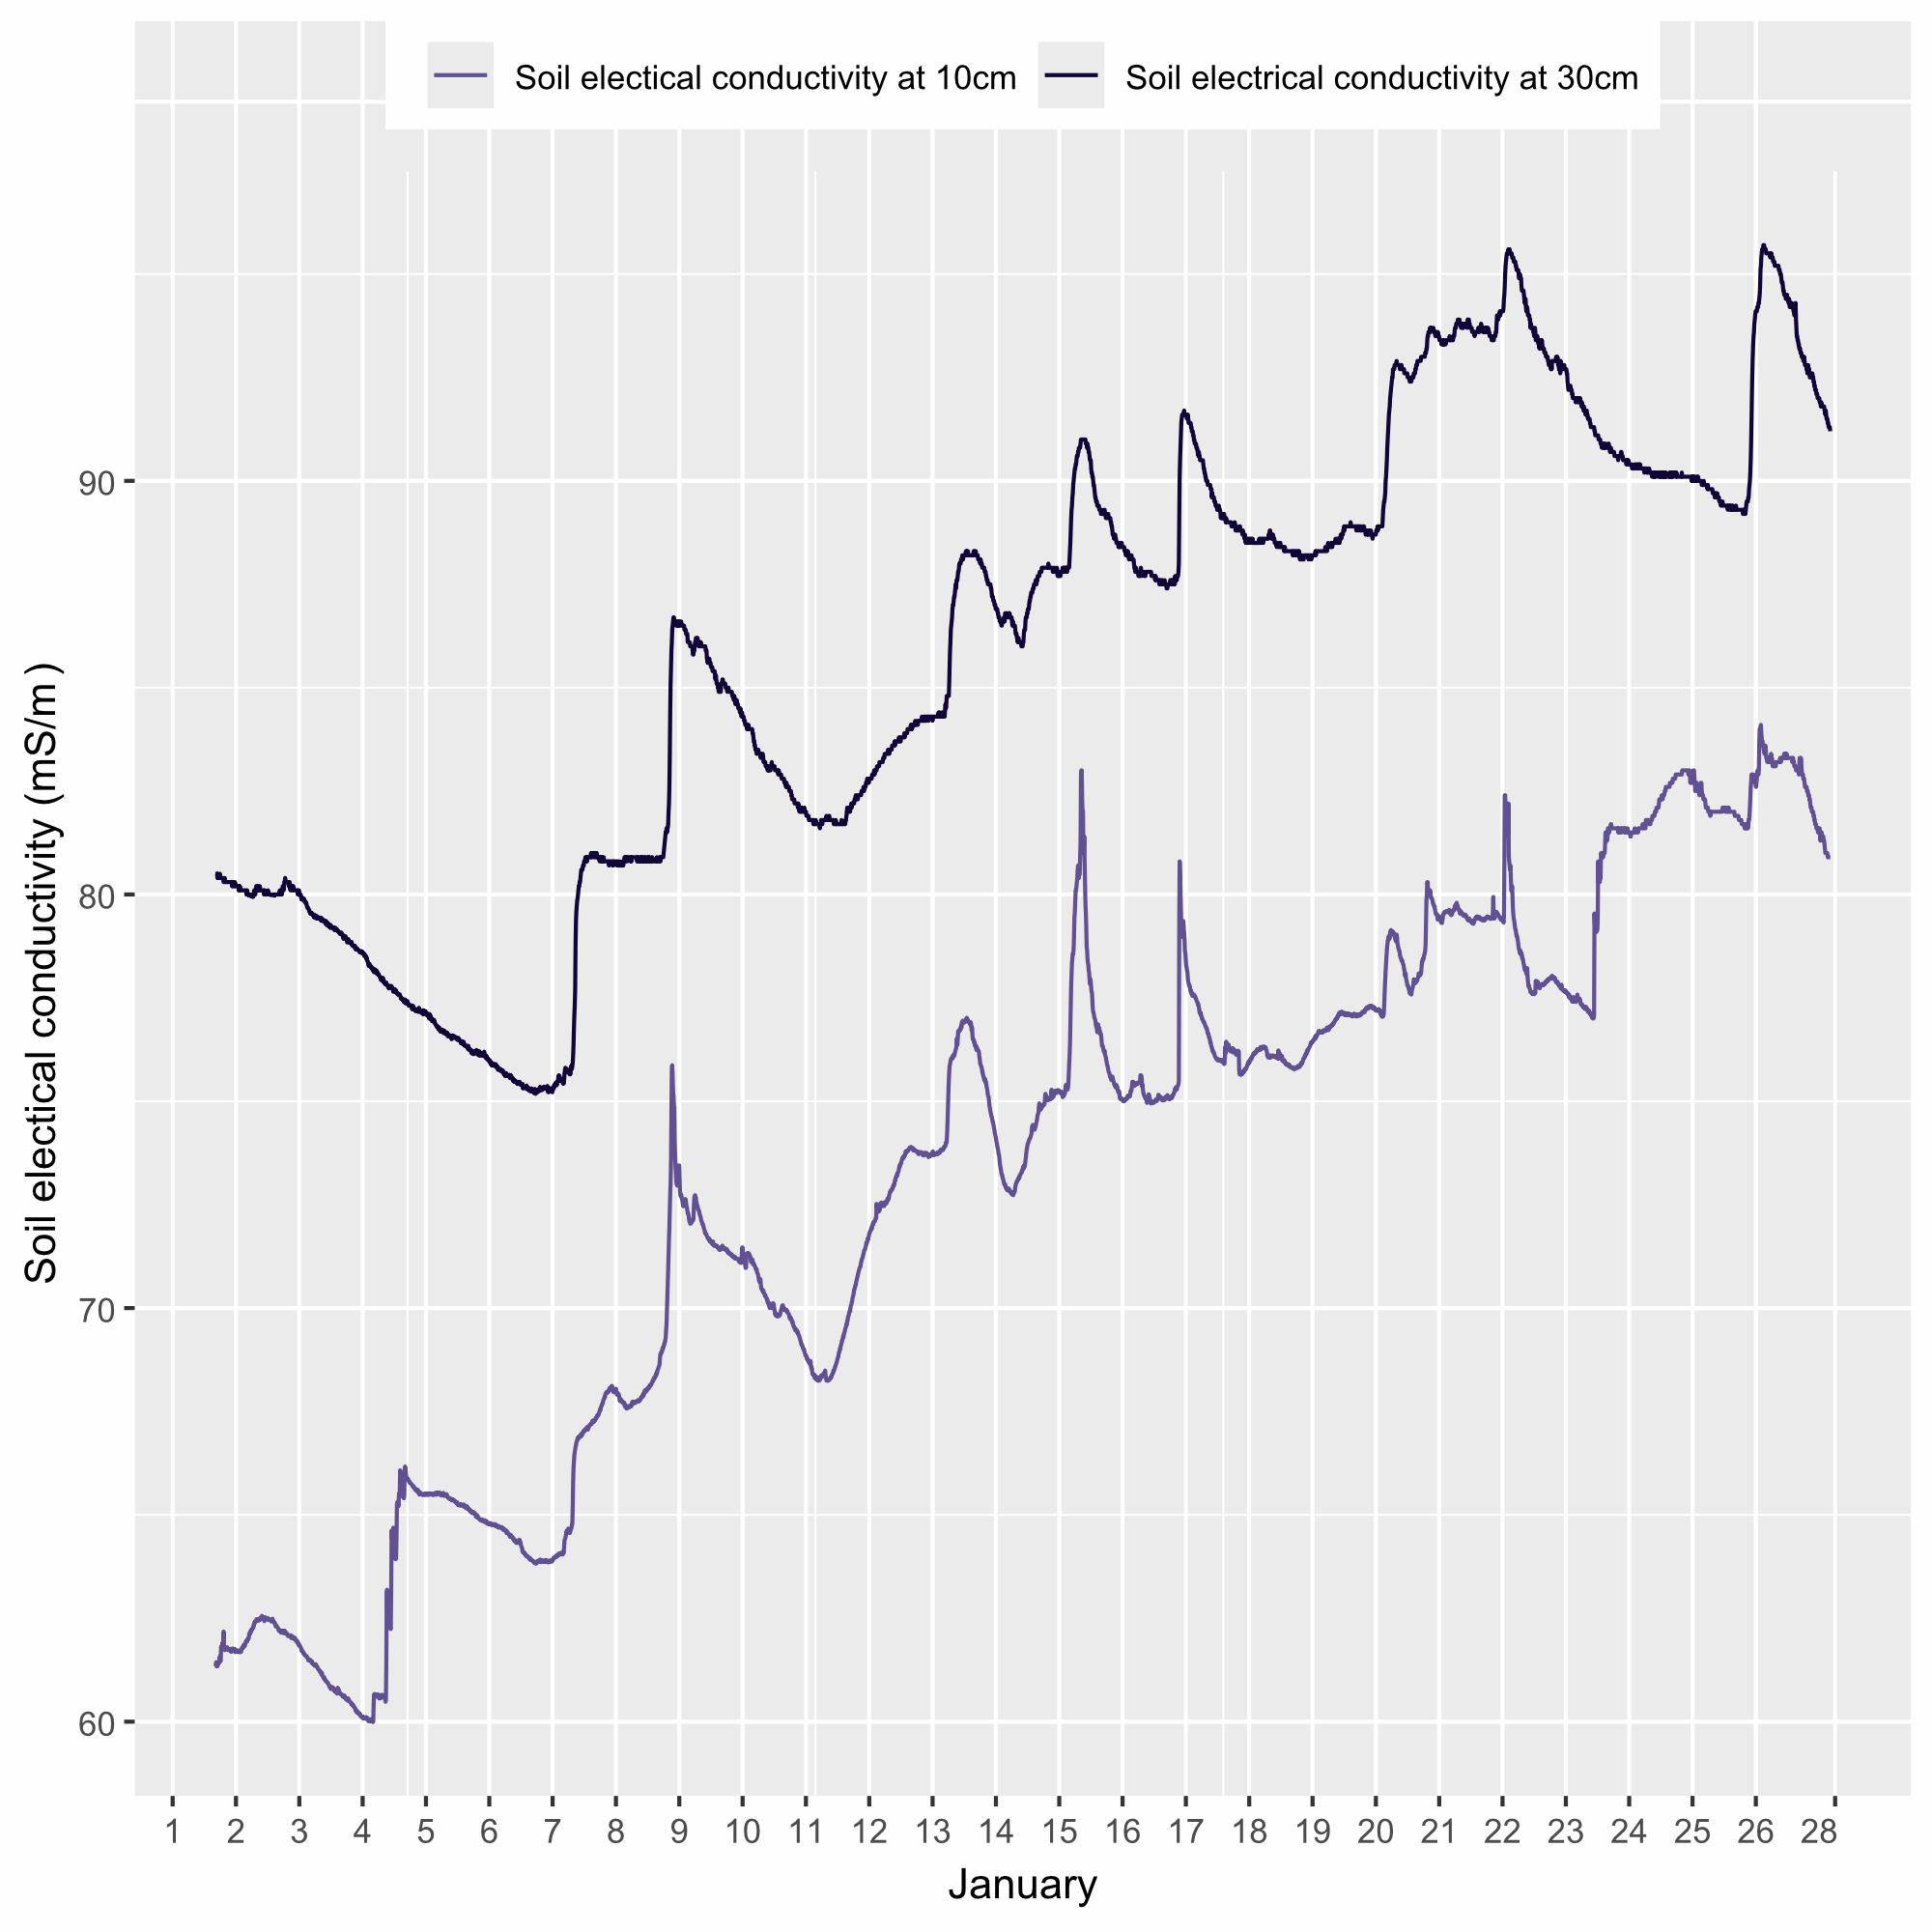
Electrical conductivity and matric potential
The extent to which soil water can carry electrical current is sometimes used as an indicator of salinity as it varies depending on the composition of cations (e.g. Na+, Ca+, K+, NH4+) and anions (e.g. SO4–, Cl–, NO3–) from salts that are dissolved in soil water.
Both conductivity and soil matric potential (or “water suction potential”) vary depending on the soil composition, water quality, temperature and salinity.
It’s important to understand how these fluctuate with the weather when we are analysing samples from our OpenLiving Lab for soil pH and nutrient composition. Seasonal variation and fluctuations with precipitation need to be taken into account when mapping and investigating changes in soil properties across the woodland and meadow sites.
Click on the links for more details on how we are analysing pH, Phosphorus, Nitrogen and Carbon.
The OpenLiving Lab is part of the award-winning OpenSTEM Labs of the Open University. You can view and access our data on the OpenLiving Lab pages of the OpenSTEM Labs. If you don’t have an OU account you will need to create a free one.
Further reading
Soil Matric Potential. www.soilsensor.com
NSDA (2011). Soil Quality Indicators. https://www.nrcs.usda.gov/sites/default/files/2022-10/Soil%20Electrical%20Conductivity.pdf
https://ugc.berkeley.edu/background-content/reflection-absorption-sunlight


