
Soil Nutrients : Carbon and Nitrogen
Nitrogen is taken up by plants, where it can be stored long term or lost when leaves are shed or consumed by herbivores. It might then be taken up by fungi or pass through a detritivore, becoming part of the soil again and recycled to become part of the woodland biomass.
Carbon is an integral element in organic matter. Carbon dioxide is used by plants during photosynthesis so it can be sequestered or stored as the plant grows. However, it is lost to the atmosphere when a plant respires or decomposes.
The balance between carbon and nitrogen determines how quickly organic matter decomposes in the soil and the efficiency of nitrogen cycling. It also indicates how much nitrogen is available to plants for growth. Plants are adapted to varying levels of nitrogen enrichment and much nitrogen can lead to excessive growth of brambles, cleavers and other “weedy” species. Some of the most diverse habitats are actually more nutrient poor.
CHNS Analysis
Combustion analysis is used to determine the amount of carbon, hydrogen, nitrogen and sulphur in soil samples. To do this, the dried and ground samples that we used for pH and Olsen P need to be milled to a fine powder. This is done using a Retsch MM400 ball mill that uses steel balls to mill each sample for 5 minutes at 300 rpm.
The milled samples are weighed and dried in crucibles at 105°C overnight before cooling in a desiccator. Approximately 20 mg of each sample is weighed and sealed into small tin “boats” which are placed in the Elementar Cube CHNS Analyzer.
The analyzer heats the samples to over 1000°C in an environment of oxygen and helium. This combustion process converts the carbon to CO2, the hydrogen to water H2O, the nitrogen to nitrogen gas or nitrogen oxides, and sulphur to SO2. The nitrogen oxides are converted to nitrogen gas in the presence of copper in the reduction tube. The amount of each gas is then measured using gas chromatography and thermal conductivity detection.
This method gives us the total carbon content (TC), but we also measure the inorganic carbon content of the samples (and by subtraction the total inorganic carbon content) by running the samples through a separate module of the analyzer. This heats the sample to a lower temperature (200°C) in the presence of orthophosphoric acid, detecting the amount of inorganic carbon that is completely oxidised to CO2.
OpenLiving Lab Soil Carbon and Nitrogen content
Our samples from the OpenLiving Lab had phosphate concentrations ranging between 5 and 160 mg/kg PO4-P. Samples from the urban woodland, especially in the topsoil tended to be higher in phosphorus, but some of the samples from the meadow were particularly high too. The riparian woodland soils were lower in phosphorus, both in the topsoil and subsoil.
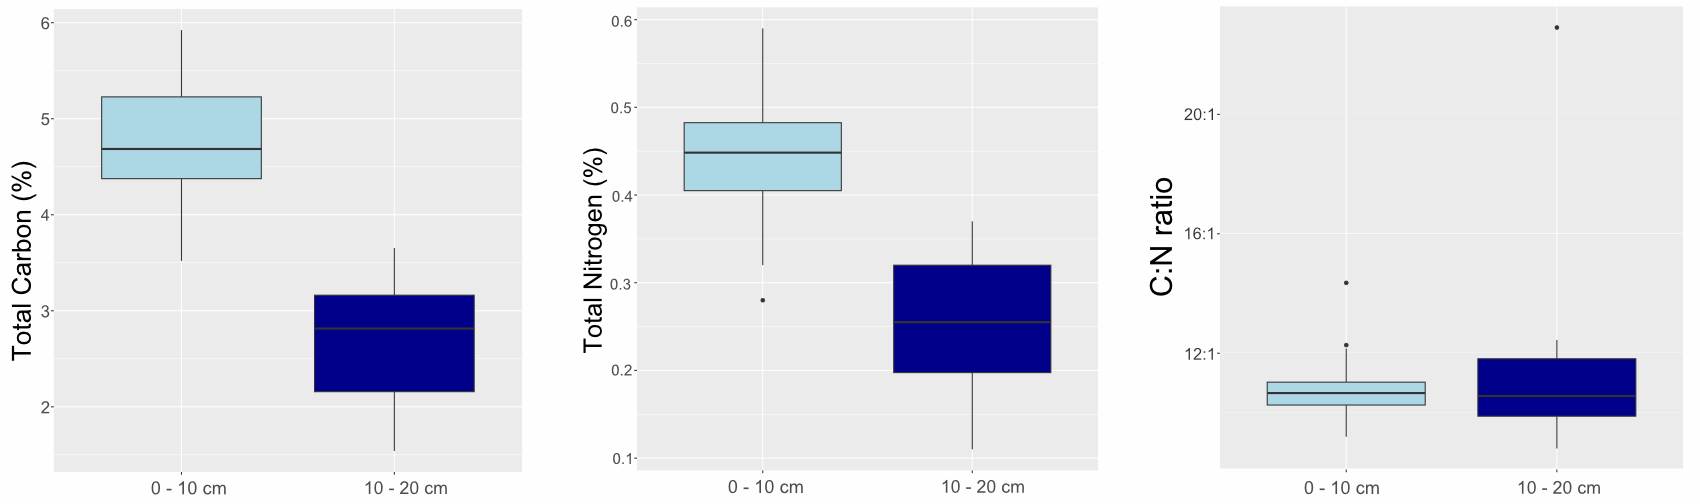
This table shows the mean ± standard deviation for Total Carbon, Inorganic Carbon, Organic Carbon, Total Nitrogen and C:N ratio for samples from the Riparian woodland (20 samples from the topsoil and 20 samples from the subsoil). The range of values for total Carbon, Nitrogen and C:N Ratio can be seen in the boxplots below.
| Depth | Area | Total C (TC %) | Inorganic C (IC %) | Organic C (TOC %) | Total N (TN %) | C:N Ratio |
| Topsoil (0-10cm) | Riparian | 5.05±0.66 | 0.27±0.17 | 4.78±0.69 | 0.45±0.08 | 10.85:1 |
| Subsoil (10-20cm) | Riparian | 3.24±0.46 | 0.51±0.54 | 2.730.60 | 0.25±0.08 | 11.33:1 |
References / Further reading
Pansu & Gautheyrou 2006. Handbook of Soil Analysis: Mineralogical, Organic and Inorganic Methods. Springer-Verlag, Berlin Heidelberg.


