
Soil Nutrients : Phosphorus
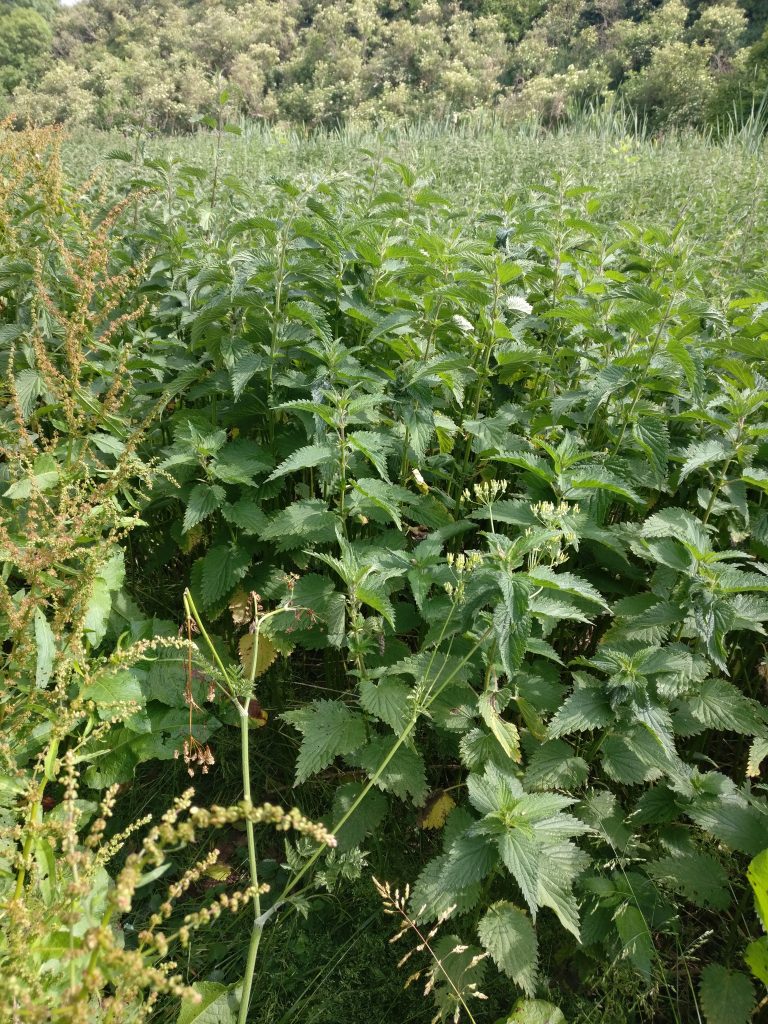
Phosphorus is an essential plant nutrient. It is part of DNA and ATP – the energy unit that forms during photosynthesis. Plants take up nutrients from soil through their roots, but when nutrient availability is low, only specialised species can grow well. When there is plenty of phosphorus, species like nettles can take over, outgrowing other plants and leaving the site less diverse.
Phosphorus forms various compounds in the soil and only some of these compounds can dissolve to be absorbed through plant roots. We are interested in measuring the available phosphorus, that is, soluble phosphates and amino acids that can be taken up by plants.
Measuring available phosphorus
One of the most widely used methods for measuring available phosphorus is Olsen P. This involves using a weak extraction solution to extract just a small amount of the total phosphorus from soil to simulate the amount of phosphorus that plants would take up; colorimetry is then used to measure the phosphorus content of the extract solution.
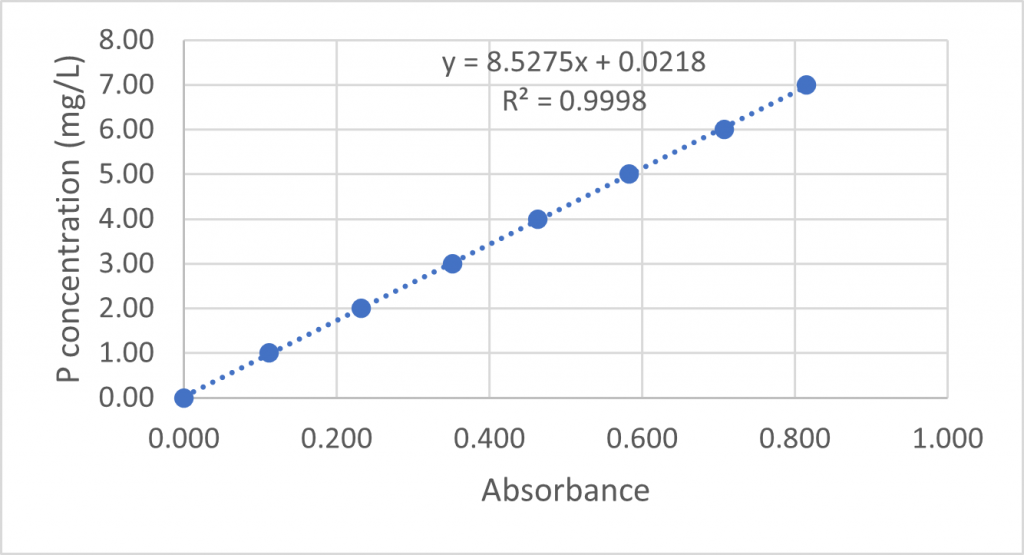
In the OpenLiving Lab, we analysed the dried and ground topsoil and subsoil samples from 20 sites in the riparian woodland, urban woodland and floodplain meadow. Available phosphorus is extracted from the soil by shaking 5 g of each sample with 100 ml of sodium bicarbonate reagent (pH 8.5). The extracts are then analysed by adding 1 ml of 1.5M sulphuric acid, 25 ml of an ascorbic acid/ammonium molybdate solution to 5 ml of each sample extract. The solution is left to stand for an hour, during which time it turns blue – a deeper shade indicating a higher concentration of phosphate. Standard samples of 1 to 7 ppm PO4 are prepared and analysed using a colorimeter to make a calibration curve and the shade of each sample can then be compared to these standards to give a reading of the amount of plant-available phosphate in each sample extract.
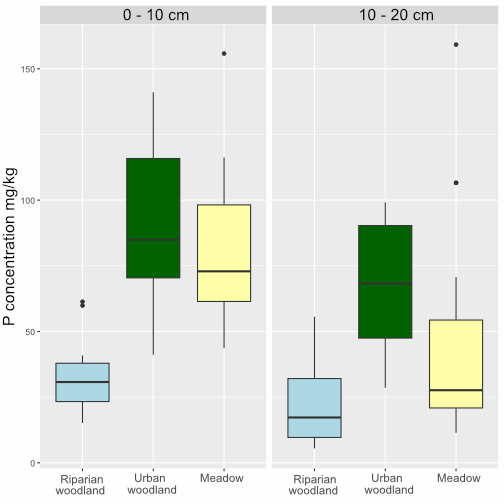
OpenLiving Lab Olsen P results
Our samples from the OpenLiving Lab had phosphate concentrations ranging between 5 and 160 mg/kg PO4-P. Samples from the urban woodland, especially in the topsoil tended to be higher in phosphorus, but some of the samples from the meadow were particularly high too. The riparian woodland soils were lower in phosphorus, both in the topsoil and subsoil.
| Depth | Area | mean P conc. mg/kg | standard deviation |
| Topsoil (0-10cm) | Riparian | 32.15 | 12.87 |
| Topsoil (0-10cm) | Urban woodland | 91.3 | 28.78 |
| Topsoil (0-10cm) | Meadow | 81.18 | 27.92 |
| Subsoil (10-20cm) | Riparian | 21.3 | 13.49 |
| Subsoil (10-20cm) | Urban woodland | 67.89 | 24.58 |
| Subsoil (10-20cm) | Meadow | 45.08 | 38.49 |
Related OU Research
References / Further reading
Soil sampling and methods of analysis (second edition). 2006. Edited by M.R. Carter & E.G. Gregorich. CRC Press, Boca Raton, Florida, USA.
Olsen, S.R. 1954. Estimation of available phosphorus in soils by extraction with sodium bicarbonate. United States Department of Agriculture, Washington DC, USDA Circular 939, 1-19.


